Tundra community assembly
Arctic ecosystem resilience across scale, from thriving grass to permafrost collapse
Working under this theme: Ciara Norton, Myriam Cloutier, Bailey Bingham, Jeremy Borderieux, Isla Myers-Smith, Hana Travers-Smith
As Tundra communities are threatened by climate change, it is important to analyze how they are crossing tipping points or evading them through pathways of resilience. One way ecological communities can evade tipping is through spatial pattern formation. Spatial pattern formation can offer resilience through community reassembly and by buffering changes in community-structure.
Here is a nice video summary of the theory behind it.
Through the research of Team Shrub, an Arctic ecology lab at the University of British Columbia, we are studying how tundra vegetation communities are impacted by climate change and how spatial patterns can lead to increased or decreased resilience under climate change. By doing so, we are validating theoretical concepts of spatial pattern formation and tipping in tundra ecosystems that have not been studied in this context much before, and creating new models using real-world data. But what does it look like to study the resilience and vulnerability of tundra ecosystems?
First step: fruitful data collection
Oh, how the time flies when you are collecting 4,833 data points of plant observations, flying 45 drone surveys, installing 31 new trail cameras, collecting audio recordings from 40 autonomous recording units and pondering life under the midnight sun. At least that’s what last summer looked like for the Team Shrub Arctic team.
We spent 50 days conducting field work on Qikiqtaruk – Herschel Island, a remote island located on the Yukon North Slope in Canada. Qikiqtaruk is a special place, with a rich cultural history (there are whaling sites and archeological sites on the island), a diverse tundra ecosystem, and most importantly is home to Inuvialuit.
Unfortunately, Qikiqtaruk is threatened by climate change as increasingly warmer summers are causing dramatic permafrost thaw, unprecedented flooding, changes to vegetation communities and to the wildlife that occupy it as their habitat.
Our group Team Shrub has been studying these impacts since 2008. Recently, this research has been brought to the European Research Council RESILIENCE project as we have been working with the RESILIENCE team to study how tundra ecosystems are crossing tipping points and how spatial pattern formation buffers these changes.
Specifically, we have been studying how Arctic warming is causing permafrost to cross new tipping points of thaw, how spatial patterns formed by permafrost degradation alters vegetation community composition and how recent warming is starting to trigger plant species decline.
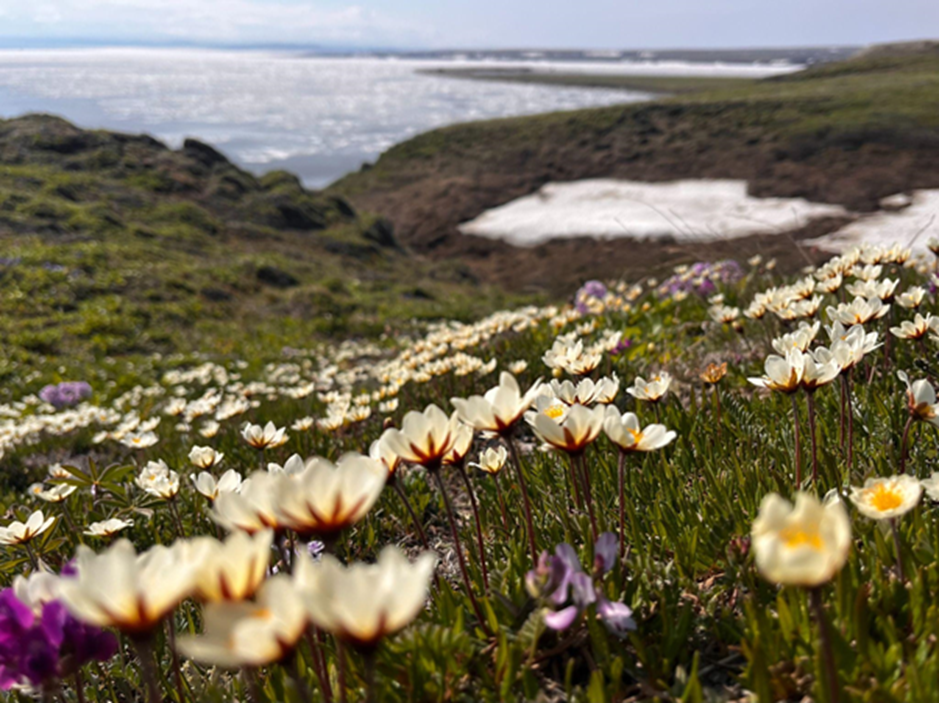
Figure 1. A meadow of flowering Dryas integrifolia, one of the iconic vegetation species that makes up the diverse ecosystem on Qikiqtaruk. (credit: Ciara Norton)
Is rapid warming causing permafrost to cross tipping point of thaw?
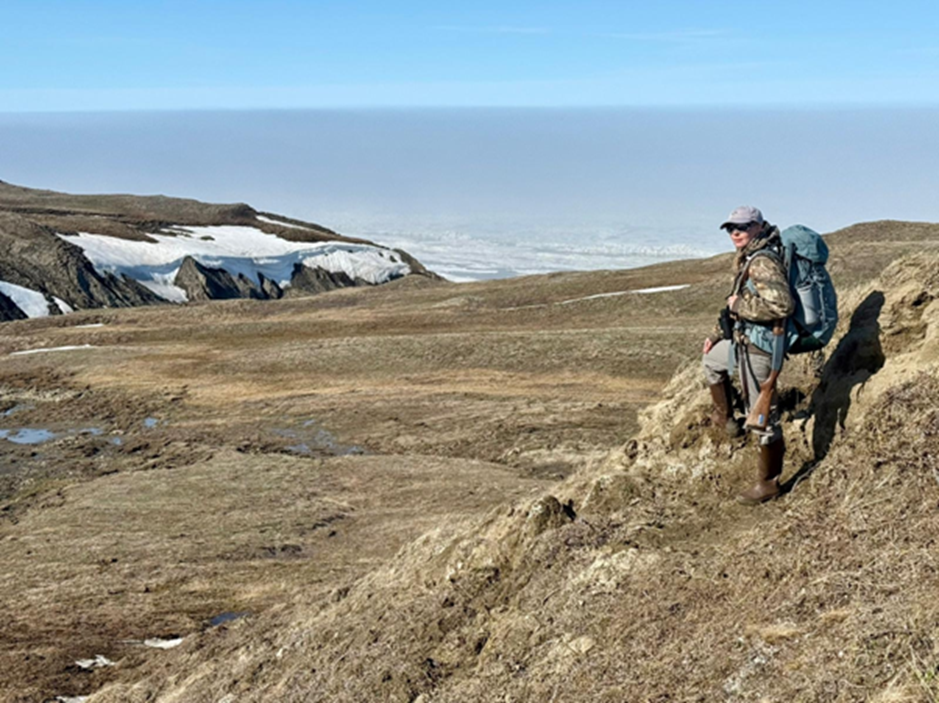
Figure 2. Ciara Norton, master student in team shrub leading research on the tipping points of abrupt permafrost thaw. (credit: Isla Myers-Smith)
Although permafrost thaw and coastal erosion is causing Qikiqtaruk to disappear into the ocean, it is somewhat of a miracle that Qikiqtaruk exists in the first place as a rare sequence of events caused its formation. Qikiqtaruk is the only island along the Yukon Arctic Coast. It was formed from the advance of the Laurentide ice sheet 10,000 years ago.
During its advance, the ice sheet uplifted and displaced glacial sediments from the Earth’s surface, leaving behind an ice-cored moraine. This ball of ice is the Qikiqtaruk we know today, and is the reason the island is composed of some of the most ice-rich permafrost in the Canadian Arctic. This makes the island extremely vulnerable to accelerating rates of Arctic warming and subsequent permafrost thaw. Qikiqtaruk was also not always an island. It originally was a part of the Yukon mainland, but was separated approximately 1600 years ago as the sea level rose with glacial melt, separating the two land masses.
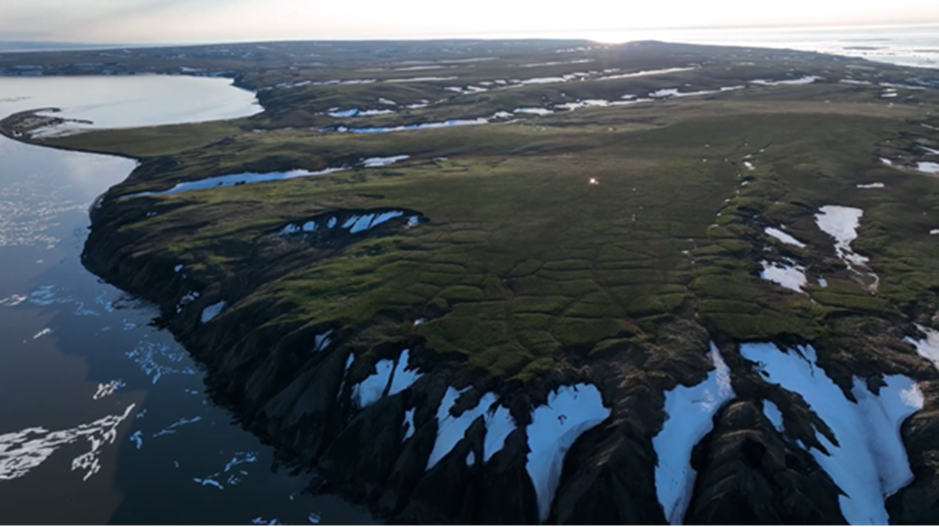
Figure 3. Ponds formed in the depressions of ice-wedge polygons glisten on sunny June day. (credit: Ciara Norton)
When spending time on Qikiqtaruk, you are immediately confronted with the dramatic permafrost thaw happening across the island. In 2023, over 700 landslides formed on the island in response to a three-week heat wave of temperatures approximately 5°C warmer than the 30-year average. The 2023 landslide event left the landscape looking like an overripe banana, covered with brown patches of mud covering every slope.
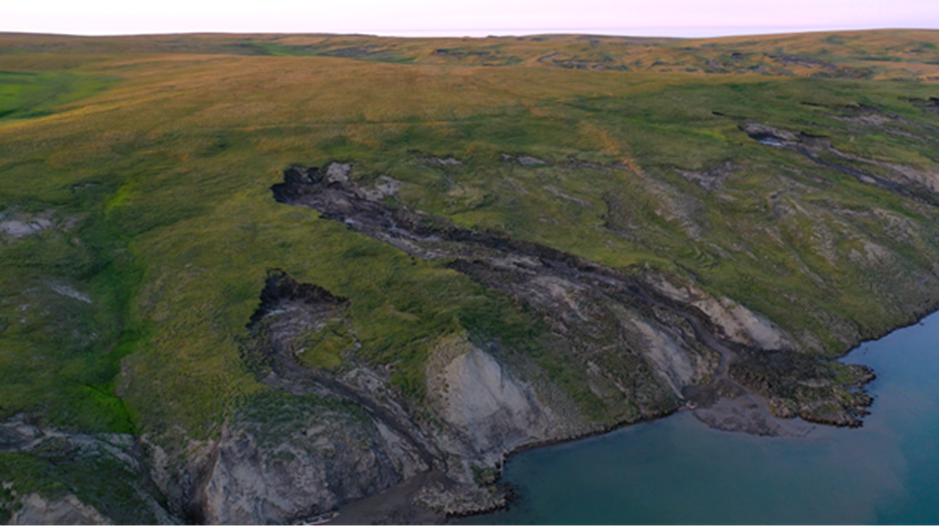
Figure 4. Permafrost landslides thawing in the summer heat, painting the slopes with streams of mud that flow into the waters of Pauline cove. (credit: Ciara Norton)
These landslides removed vegetation and polluted waters, disturbing the habitat of many focal wildlife species that are important to Inuvialuit for subsistence hunting, such as the Porcupine Caribou and Dolly Varden Char. Landslides released large quantities of carbon that had been frozen deep in the permafrost for since the pleistocene era, thousands of years ago when mammoths roamed the Arctic.
Landslides also removed the top layer of insulating tundra, exposing the ice-rich permafrost beneath to warmer surface temperatures. This can cause further thaw creating thaw slumps, which are large holes in the landscape caused by permafrost thaw that continue to thaw and release carbon for years to decades. Due to the methane they release, thaw slumps have a stinky aroma and look as if a giant took a massive bite out of the landscape.
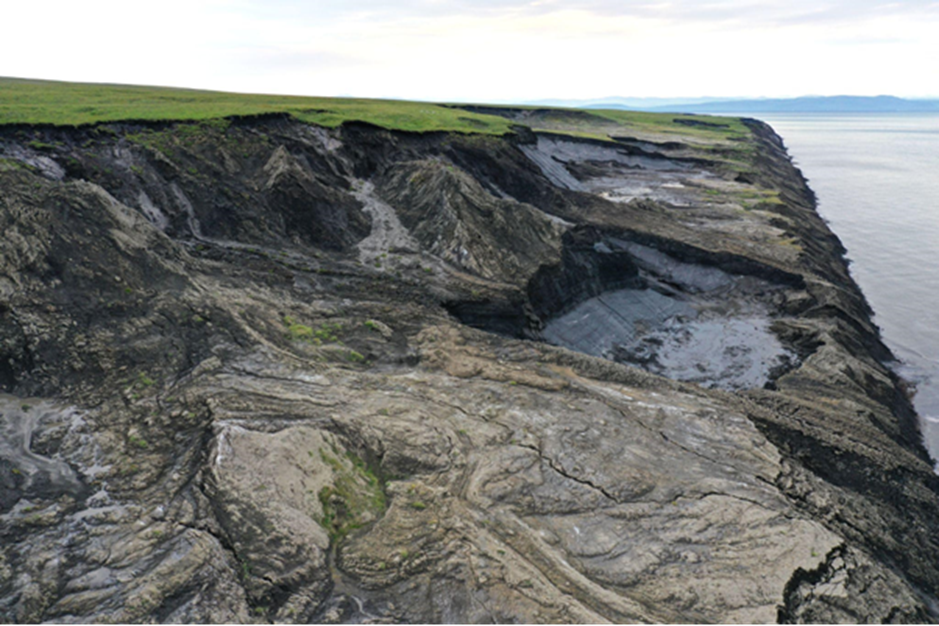
Figure 5. A megaslump on the northwest coast of Qikiqtaruk. This slump has slumps within slumps (almost like russian nest dolls) which is known as polycyclic slumping. (credit: Ciara Norton)
The 2023 landslide event caused tipping points to be crossed at both short timescales (1-month) and long timescales (decades to centuries). Although vegetation can re-establish after the permafrost stabilizes, different species establish in the landslide scars, permanently altering community composition in these areas (long timescale).
The landslides formed in 2023 cover approximately 1% of the island, causing a tipping point in vegetation loss (short timescale). If the landslides don’t stabilize and continue to thaw and grow, we observe a second tipping point when they transition into thaw slumps as thaw slumps continue to thaw and grow for years to decades (long timescale).
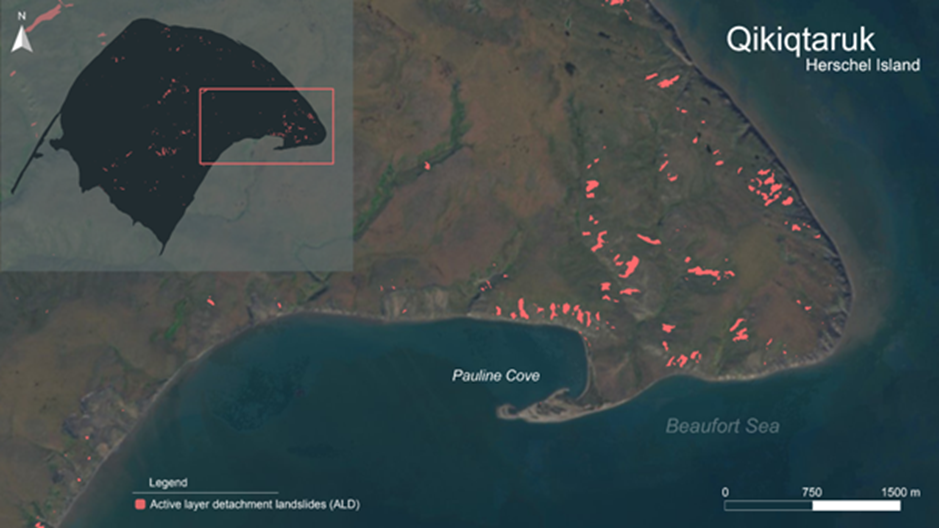
Figure 6. A map of over 700 active layer detachment landslides that formed due to a three-week heat wave of extreme temperatures thawing the ice-rich permafrost below. (credit: Ciara Norton)
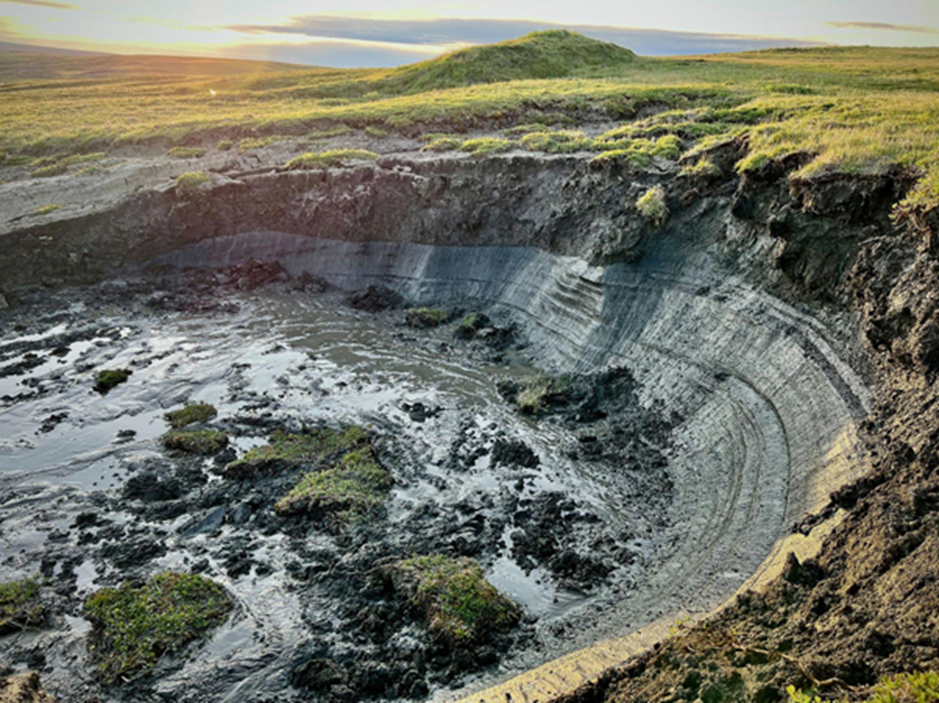
Figure 7. Despite refreezing in the cold temperatures of winter, this landslide thawed and grew into a slump the summer after it formed. The shiny ribbons of ice-rich permafrost glow in the Arctic sun before embarking on its final adventure into the Beaufort Sea. (credit: Isla Myers-Smith)
But what does field work look like for monitoring permafrost thaw? The answer could be easily summarized in three words: drones, drones, drones! Drones may possibly be the most essential field equipment for Team Shrub, next to Gold Fish crackers (GoldFish please sponsor us).
Drone surveys allow us to create 3D surface models of the tundra that are used to calculate rates of permafrost thaw and volume loss over time. Using these models we can quantify how much carbon has been lost from the landslides, and compare topographic properties in stabilizing and the landslides that are thawing into large slumps. Through this we can better understand what spatial patterns in vegetation, ground ice content and topography drive landslides to form and cross tipping points of thaw.
We are also using time-lapse cameras to quantify rates of thaw and slump development in landslides and to compare rates of thaw with temperature. Using a pixel-based change detection algorithm created by Ciara, we are able to quantify rates of thaw across the summer in the 20,000 images. Through this research we are establishing the relationship between warming temperatures and dramatic permafrost thaw to predict how permafrost will cross tipping points of thaw under increasingly warmer Arctic summers.
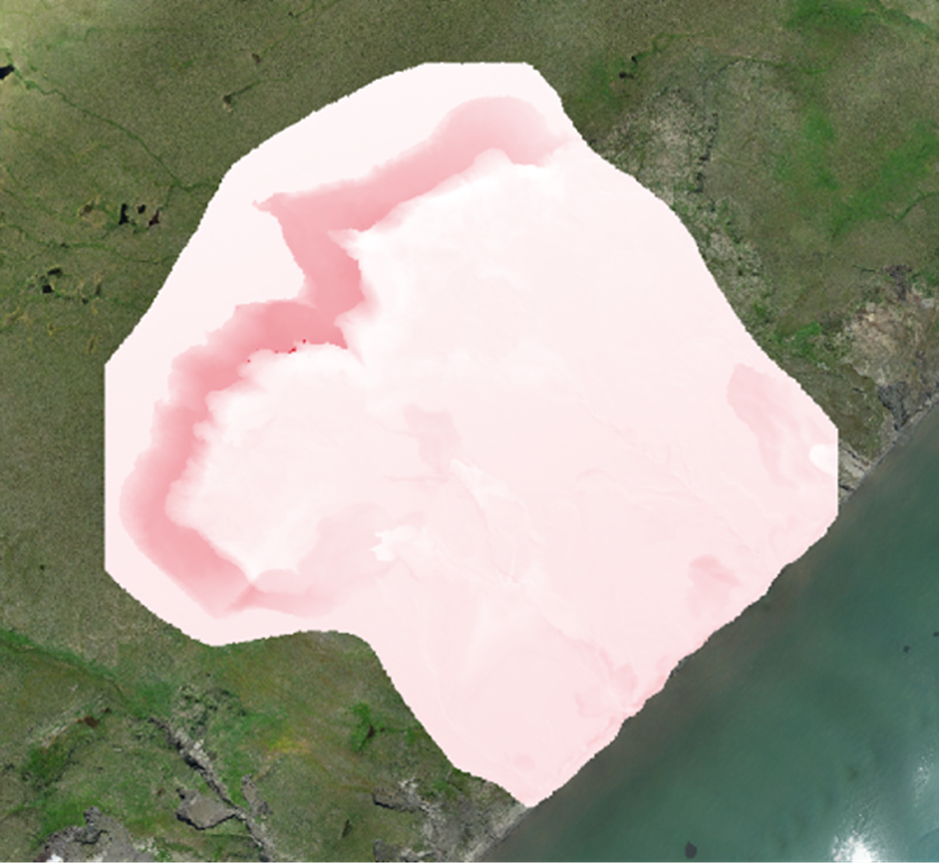
Figure 8. Drone models showing the retreat and volume loss of the megaslump “Slump D”. From 2019 to 2024, Slump D lost approximately 1,000,000 cubic metres of permafrost to the Beaufort Sea. That is equivalent to over 400 Olympic swimming pools! (credit: Ciara Norton)
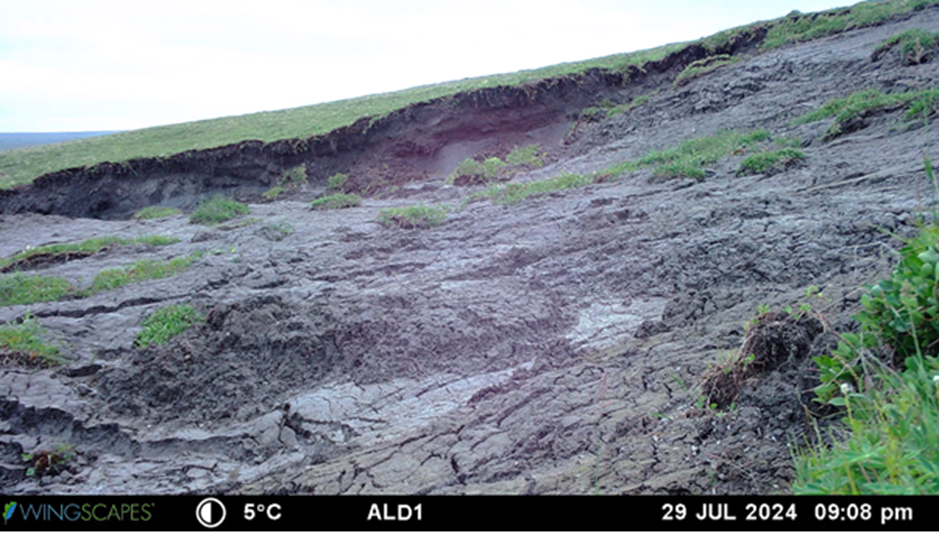
Figure 9. Time-lapse photography showing the rapid thaw and slump development in a landslide on Qikiqtaruk. As the permafrost thaws, it exposes “massive ice”, which is permafrost left behind by the Laurentide Ice Sheet (over 20,000 years old) and extremely vulnerable to thaw. (credit: Ciara Norton)
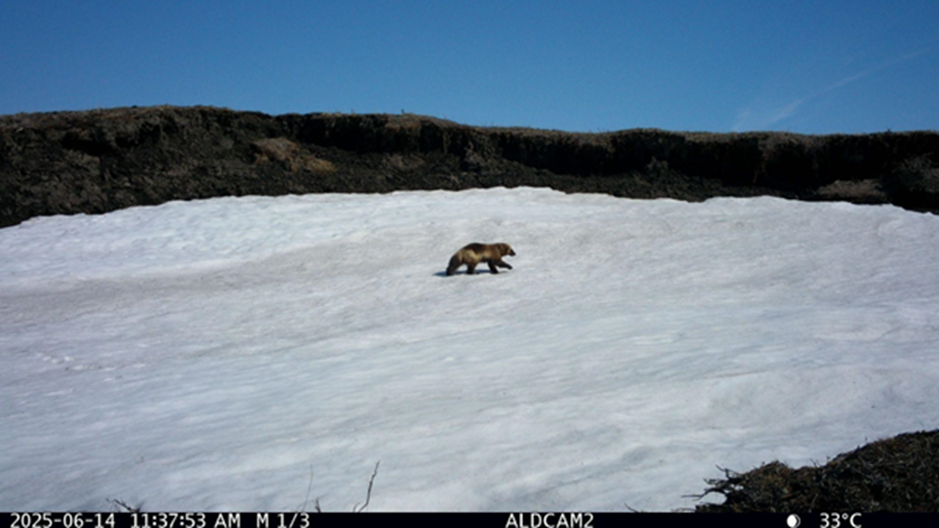
Figure 10. The thaw-detection algorithm captures more than just permafrost thaw. A wolverine visits a landslide in June. (credit: Ciara Norton)
Combining plant ecology and permafrost science to understand landscape changes in the Arctic
Myriam’s PhD research is looking at patterns of permafrost thaw across the landscape and how these spatial patterns in the ice-rich soil are impacting tundra vegetation in a warming Arctic. She is also aiming to understand the trajectories of Arctic vegetation in degrading permafrost soils using a long time-series of data.
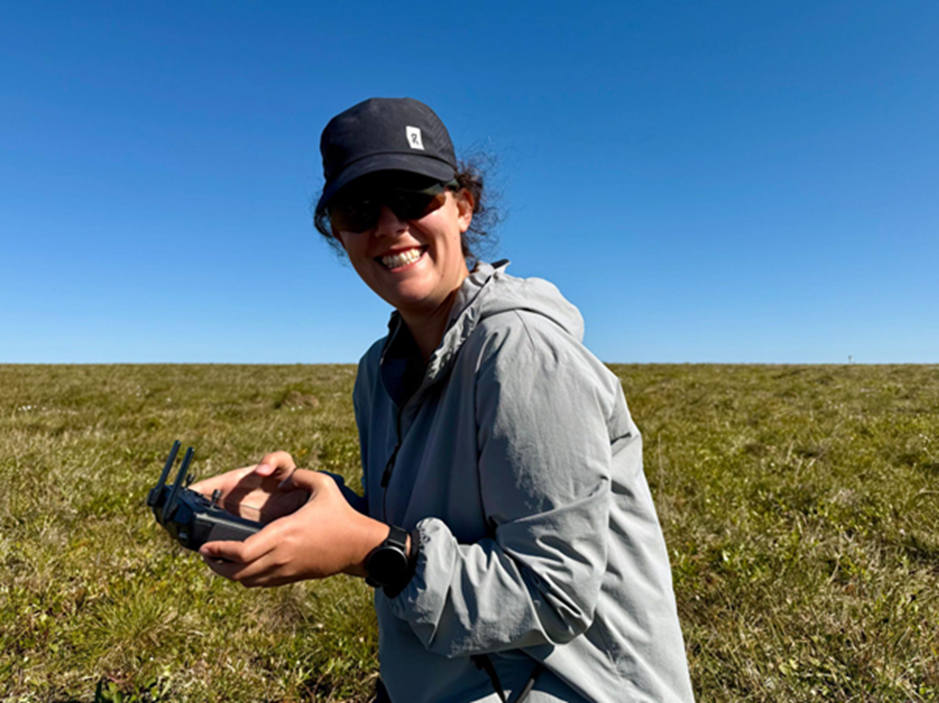
Figure 11. During summer 2025, Myriam made her first trip to the Arctic on Qikiqtaruk where she witnessed the midnight sun and the vastness of the Yukon North Slope. She flew 13 drone surveys across the Northern Yukon, and is excited to fly even more in 2026! (credit: Isla Myers-Smith)
In addition to abrupt permafrost thaw, the permafrost soil across the Arctic is covered in gradual thaw features that form through decades or centuries, but the formation of these features is accelerated through climate change. When flying into the field or going from site to site in a helicopter, it’s hard to miss all these geometrical shapes, large ponds and mosaics of colours across the landscape.
Thaw features can take many different forms, two being more prominent and widespread on Qikiqtaruk. Ice wedge polygons (here we are surrounded by polygons!) are formed by the freeze and thaw cycle of the permafrost, creating large wedges of ice underground which form the lines of the polygon shape. Frost boils (there is a large patch of them just above us), also created by the freeze-thaw cycles, are small patches of bare soil where the soil is lifted by the freezing water, a process called frost heave.
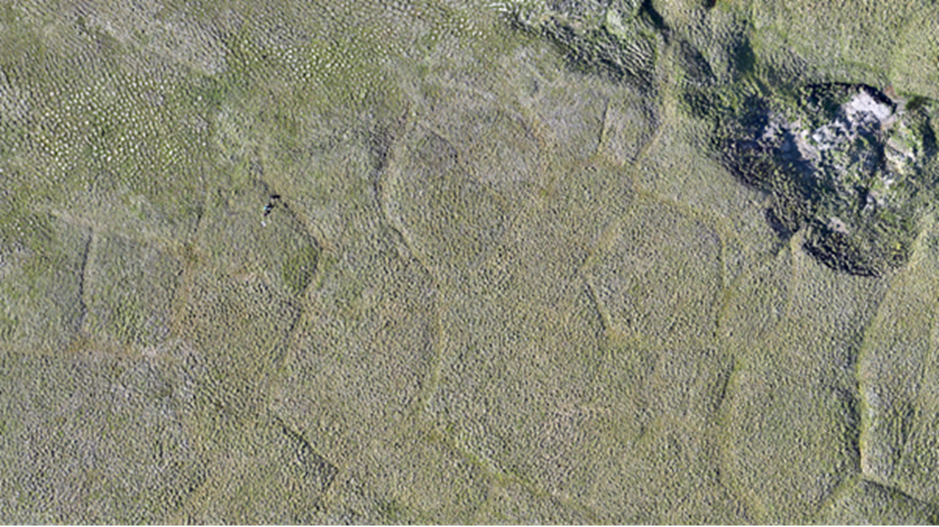
Figure 12. Can you find us in this photo? Much like in this photo, ice wedge polygons are widespread across Qikiqtaruk. They are much easier to see from drone imagery than from the ground due to their size. (credit: Myriam Cloutier)
Permafrost thaw has huge impacts on tundra ecosystems. It can alter the flow and availability of water, create microtopography across the landscape and can cause soil erosion as mentioned previously. One way permafrost degradation happens is through a deepening of the active layer, which is the layer of soil that thaws every summer. This is also the depth at which vegetation can grow below ground and access water, nutrients and space for its roots.
The opposite is also true, vegetation cover also has an important impact on active layer depth by providing insulation through shade in the summer and snow interception in the winter. These interactions are changing with global warming and are reshaping Arctic landscapes through accelerated permafrost degradation and increased shrub density, a phenomenon called shrubification.
Within only a decade, we are able to see changes related to permafrost thaw, specifically newly visible ice wedges, and vegetation composition through shrubification and increased plant growth. See for yourself in these images from 2016 and 2025!
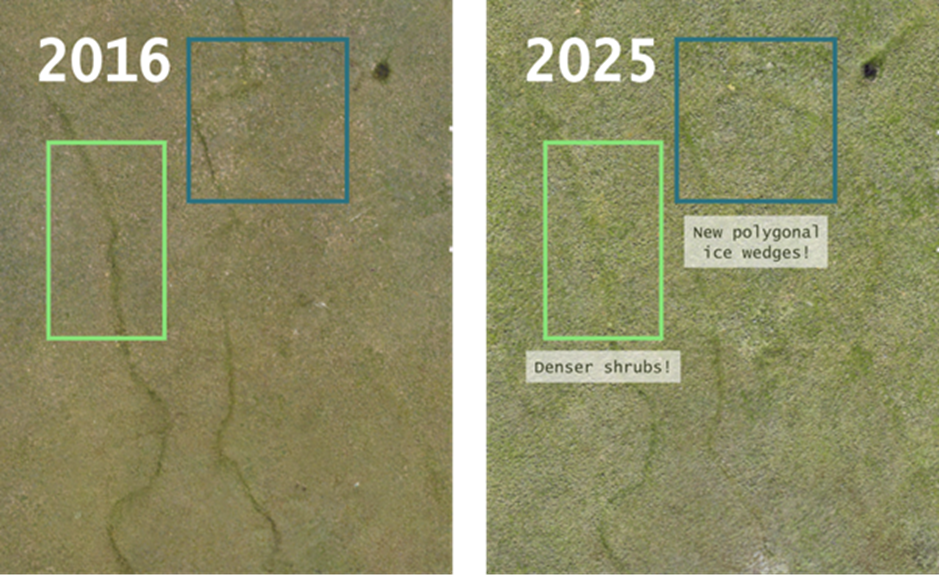
Figure 13. These drone surveys were taken at the same time of the year by members of Team Shrub, but a decade apart. This comparison shows how vegetation has changed across this site, especially around the ice wedge polygon line (in green), and additional evidence of permafrost thaw (in blue). (credit: Jakob Assmann (left), Myriam Cloutier (right))
How do we detect and monitor these changes across the landscapes? You guessed it, more drones! We are using a multispectral drone, which captures a total of five spectral bands (wavelengths in the electromagnetic spectrum), two more wavelengths of light than the human eye. With these, we can calculate different spectral indices (combinations or ratios of wavelengths) informing us on plant health and water stress. Similarly to the surface models described earlier, or topographic models, we can get a high-resolution 3D view of these patterns of permafrost through precise elevation data and compare these from year to year.
Combining the multispectral indices, we calculated with topographic maps can help detect patterns of tundra resilience or vulnerability and inform us of the trajectories of these ecosystems in a warming Arctic. We will also scale these detections to larger areas using satellite images and assess the limitations and advantages of using these sensors.
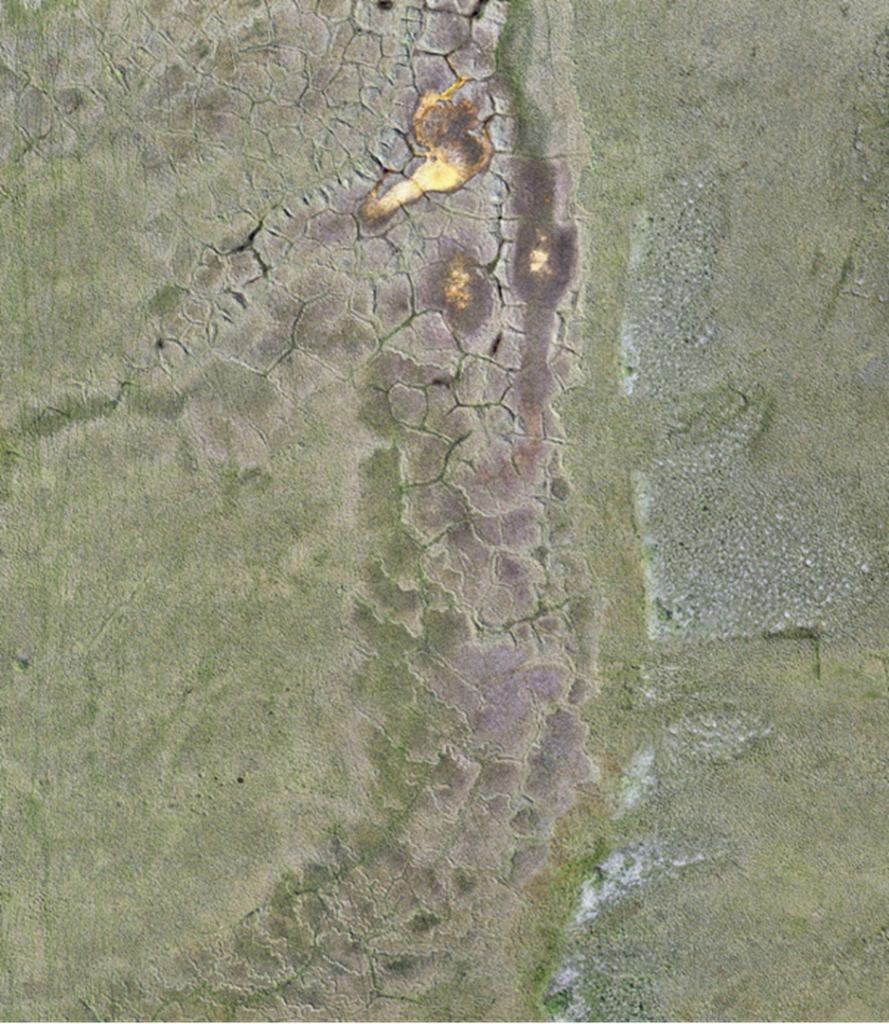
Figure 14. This is a site on the Yukon North Slope characterised by all sorts of patterns: ice wedge polygons of various sizes, frostboils to the right, and caribou tracks going up and down this site! (credit: Myriam Cloutier)
Time-lapse cameras, also called phenocams, which capture images every day up to multiple times a day all year round, can also be used to monitor vegetation all throughout the snow-free period. Plants go through seasonal cycles, described as plant phenology, which depends on climate and photoperiod (the amount of daylight that changes throughout the year). The climate is especially extreme in the Arctic, with 24-hour sun or darkness at the summer and winter solstice and snow cover and freezing temperatures for a major part of the year, creating short seasons for plants to grow and cycle through their phenology cycles. You may recognize some of these seasonal cycles as leaf budding and flowering in the spring and the changing of leaf colour in the autumn. While these events offer beautiful sights and announce the start of a new season, they are also indicators of ecosystem health as these events in the lives of plants are sensitive to temperature and water availability. We can use phenology to assess ecosystem health by detecting any spatial or temporal changes in these events.
The data we collect from the phenocams gives us information on how plant phenology trends have been changing throughout the years. Using our drone imagery of permafrost thaw, we can determine whether these changes are related to changes in the land’s surface over time. Permafrost thaw causes changes in plants’ access to water, either by making it more or less accessible depending on the topography, which affects the timing of spring phenology. Altered ground water availability is not uniform across the island, creating landscape-level patterns of change.
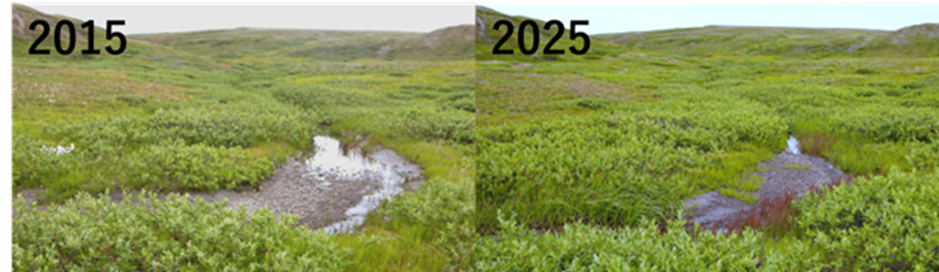
Figure 15. Repeated photograph of the same river on Qikiqtaruk, where woody vegetation such as willows are growing larger and taller over time, overtaking grassland. (credit: Isla Myers-Smith)
Tundra vegetation in the face of climate change
The increase of cover and size of woody plants we witness on Qikiqtaruk is called shrubification and is one of the most striking examples of the changes Arctic plants communities are undergoing.
Jeremy is a postdoc investigating whether plant’s affinity to climate explains their resilience or vulnerability to climate change. He uses a distributed network of resurveyed vegetation plots (International Tundra Experiment), some are monitored for more than 30 years, to study the trends of more than 200 plant species.
Plant species found in the Arctic can thrive in very different climatic conditions, the tussock-forming Eriophorum vaginatum also grows in continental Europe whereas Dupontia fisheri is cold-adapted and mostly thrive in the High Arctic. Jeremy studies whether cold adapted species are declining because they are not expected to benefit from climate change as much as warm-adapted species. If that is the case, that would mean that the Arctic flora is less resilient than previously thought. This would also imply that vegetation changes can be predicted with more accuracy as the climate affinity of a species is stable and easily estimated.
This summer, Jeremy left his office and his statistics books to partake in the monitoring of the 12 ITEX plots on Qikiqtaruk.
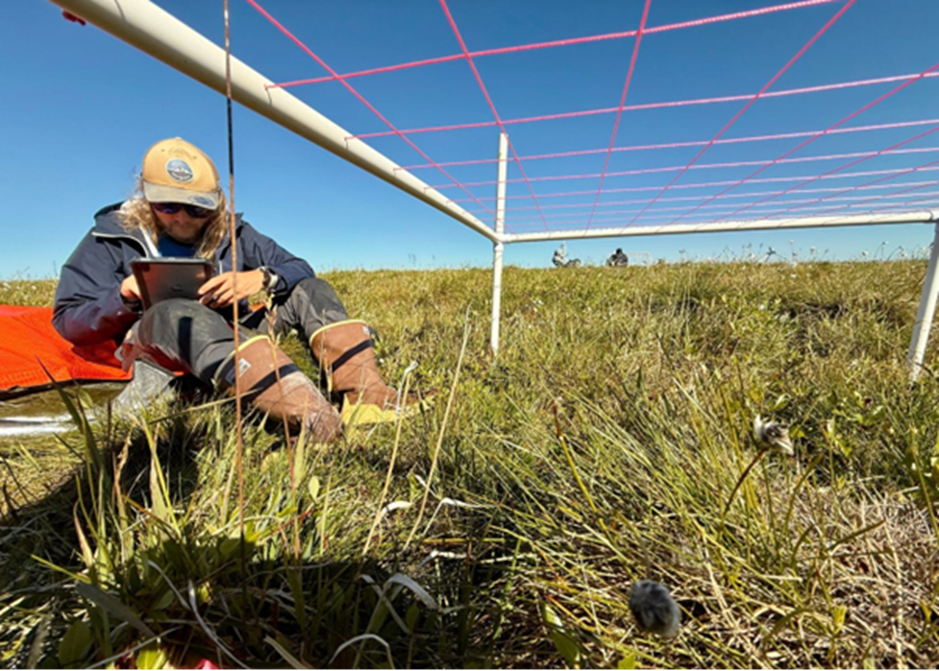
Figure 16. Jeremy is recording the species hit by the point-framing method. To complete a plot, a pin is dropped one hundred times and each plant species that touches the point is identified and recorded, giving a good approximation of plant cover ranging from 0 to 100%. (credit: Isla )
This field campaign marks the 15th vegetation survey of Qikiqtaruk, the first dating from 1999. Those data in combination with long-term monitoring of tundra plants from 25 other circumpolar sites, will be crucial to understand current and future plant community shifts.
The frame we use to record plant cover is a square grid of 100 points, 10 centimetres apart, when recording species we also keep track of where they are on this grid.The spatial nature of data will also allow testing how spatial patterns of vegetation determine the change we observe in the community. For example, the tussocks formed by the cottograss (Eriophorum vaginatum) are very dense and no other plants can really access this part of the tundra, leading to a housing crisis for species that try to colonize the plot.
Jeremy also got the opportunity to install new microclimate sensors in the lowland and mountainous part of the Ivvavik National Park to extend our network of sensors from Qikiqtaruk to the Yukon North Slope. A better understanding of microclimate, the conditions the plants actually experiences, will be very helpful in understanding what does and does not trigger change in the plant community.
After having learned to identify more than 50 Arctic plant species to boost his inaturalist observations and experienced the tangible and contemplative ITEX protocol, Jeremy returned to his statistical work with improved understanding of the data.
Stay tuned for the results of this ITEX synthesis.
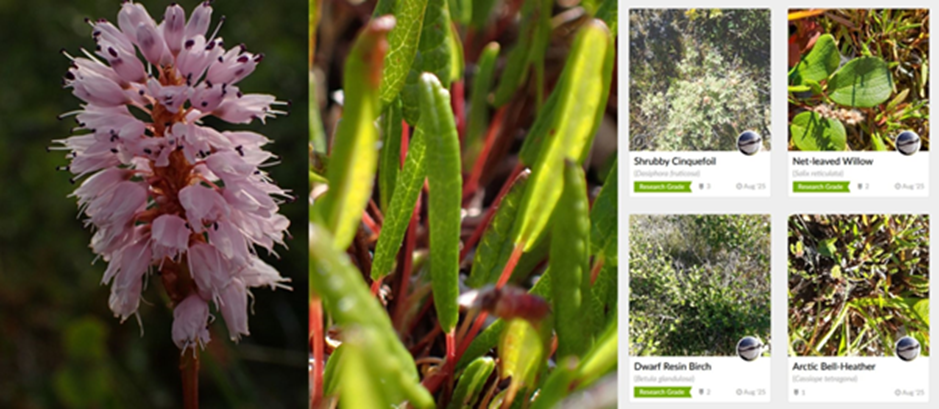
Figure 17. A Bistorta vivipara flower, Dryas integrifolia leaves and Jeremy’s list of iNaturalist observations. (credit: Jeremy)
Beyond gradual warming: exploring the impact of heat waves on tundra vegetation
In summer 2026, new PhD student Bailey, will be heading to Qikiqtaruk–Herschel Island to study how tundra plants are responding to summer heat waves. Heat waves are becoming more frequent in the Arctic, and while we have a growing understanding of how gradual warming affects tundra vegetation, we know much less about how these short periods of unusually high temperatures influence plant growth, timing of life cycle events, and overall plant performance and how these impacts might vary across the highly heterogeneous environmental conditions of the Arctic.
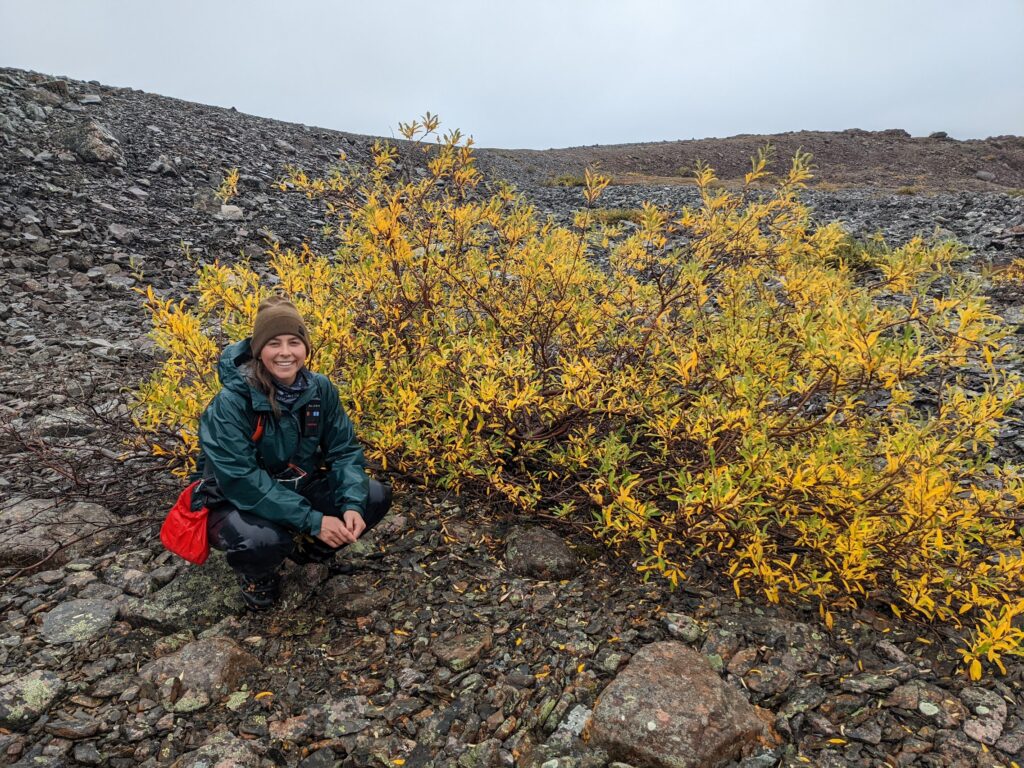
Figure 18. New PhD student Bailey Bingham with a surprisingly large willow shrub during previous work in Nunavut, Canada. This willow is growing in a particularly warm and wet lowlaying area.
To capture how plant communities respond to these heat waves under natural conditions, Bailey will be installing and maintaining Phenocams across contrasting tundra habitats. These time-lapse cameras collect daily images of the landscape throughout the growing season, allowing us to track when plants green up, flower, and senesce. By pairing these phenology records with microclimate data, we can begin to understand how heat waves shape the seasonal rhythms of tundra vegetation and how these responses vary across the island’s diverse environments.
While the next field season will provide new observations, we don’t have to wait until summer to begin exploring how heat waves affect tundra plants! In the lab, we are about to start a new growing season in our climate-controlled growth chambers using tundra monoliths collected from Qikiqtaruk during the summer of 2023. These intact sections of tundra vegetation and soils include plants, roots, and the surrounding soil communities, bringing a small piece of the island into a controlled experimental setting. After months in freezers, these monoliths will soon be thawed out and exposed to simulated Arctic summer conditions, including experimental heat waves.
We are so excited to get to watch the tundra come back to life, right here in our growth chambers at UBC! As the plants thaw and begin to grow, we will be able to follow their responses to short periods of extreme warmth under controlled conditions, helping us tease apart how heat waves influence plant growth and seasonal timing. Together, the field-based Phenocam observations and the growth chamber experiments allow us to link what we see on the island with the processes driving plant responses to heat waves, building a more complete picture of how Arctic vegetation is experiencing a rapidly warming climate.
Eyes in the sky: Monitoring the tundra from above
Hana is a new post-doctoral researcher who uses images collected from drones, planes and satellites to understand how landscapes change over time. Looking at the land from a birds-eye-perspective means that we can observe areas we may not be able to reach on foot. This can help us map the scale of processes like tundra greening and permafrost thaw over very large areas. Different types of sensors mounted on drones, planes and satellites are also sensitive to wavelengths of light in the infrared spectrum that we can’t see with our eyes alone and measuring these wavelengths provide information about the composition of plants on the ground, as well as how healthy they are.
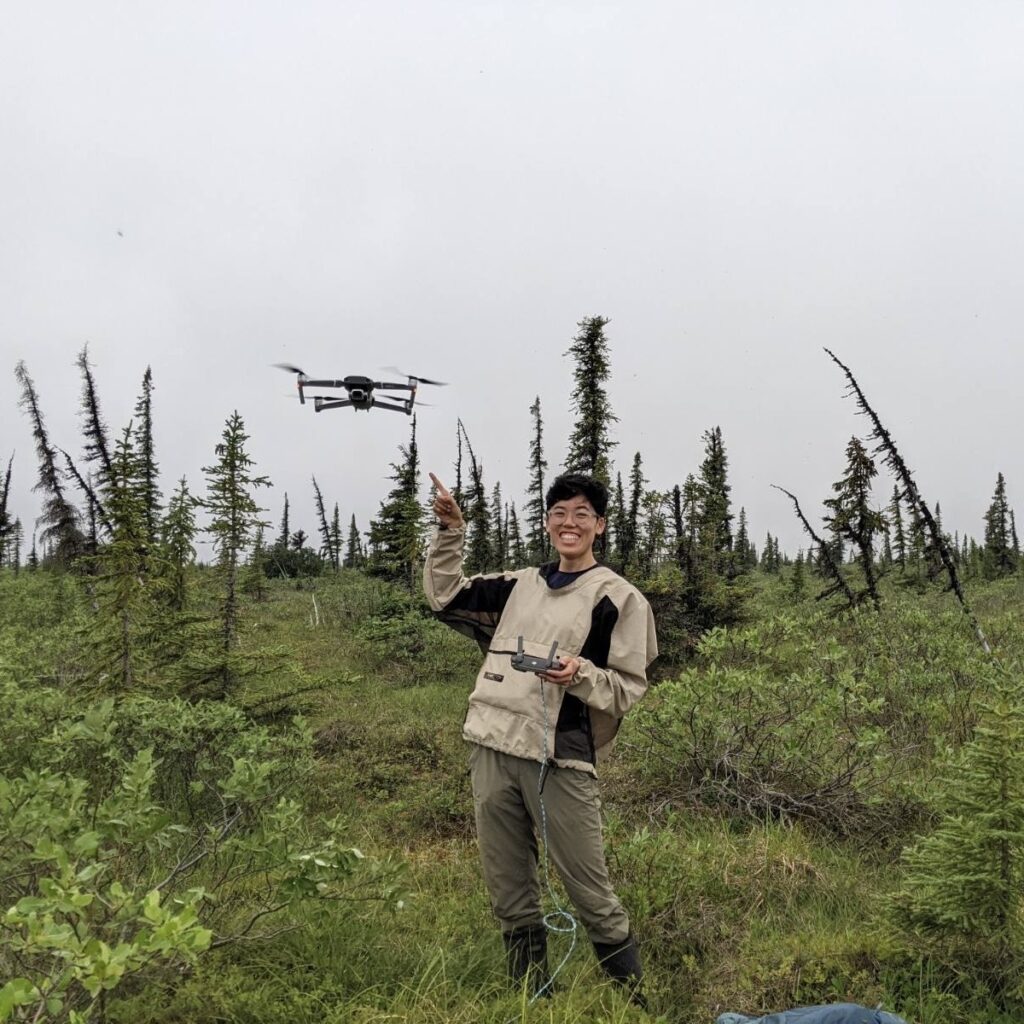
Figure 19. Hana poses for a photo with the DJI Mavic 2 drone in the forest-tundra near Inuvik, NWT, Canada. Credit: Meghan Hamp
Taking images at different scales provides different levels of detail about the landscape. For example a drone with a high-resolution camera can capture very detailed images showing the individual leaves on a shrub, but only for a small area at a time (a city block or a football field). In contrast, satellites can image the entire world but can’t resolve small details, and some information is lost. Combining both types of data provides the best of both worlds! More detailed imagery can validate observations from satellites and help us compare change in different places and make inferences about what is happening on the ground.
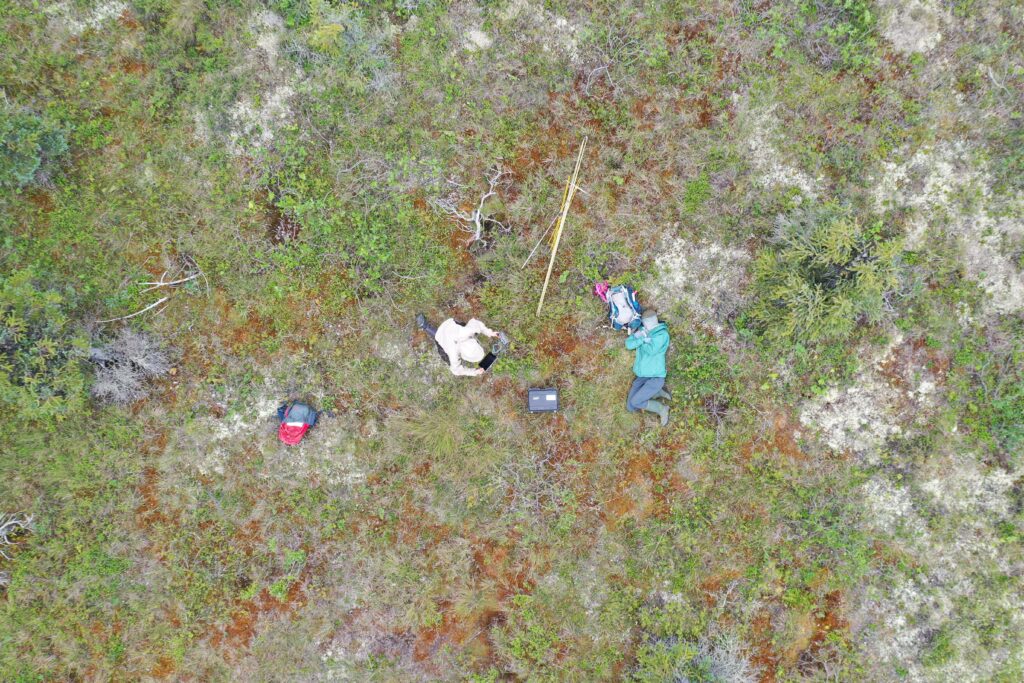
Figure 20. A birds-eye-view of field work taken from a drone approximately 30 m above the ground. Credit: Hana Travers-Smith
Hana’s research combines images taken at different times with different sensors to provide a cohesive picture of tundra vegetation change. In particular she is interested in mapping the cover of lichen patches that northern caribou depend on for their winter diet. Northern caribou are an iconic species of the Arctic and provide immense value to local Indigenous communities. Caribou also travel vast distances in a single year, and how vegetation is changing across their entire habitat (up to several 100,000 km2) is critical in understanding how stable the population will be in the future.
In the tundra, lichens grow very slowly and are extremely sensitive to disturbances like wildfires, taking up to 70 years to recover after being burned. They can also be outcompeted by shrubs that grow much more quickly and take up available space. Overall, lichen cover is decreasing across the tundra and remaining lichen patches are getting smaller and more dispersed due fires and shrub growth. Fragmentation of lichen patches will likely decrease the survival of caribou by increasing the effort it takes for individuals to find food in the winter.
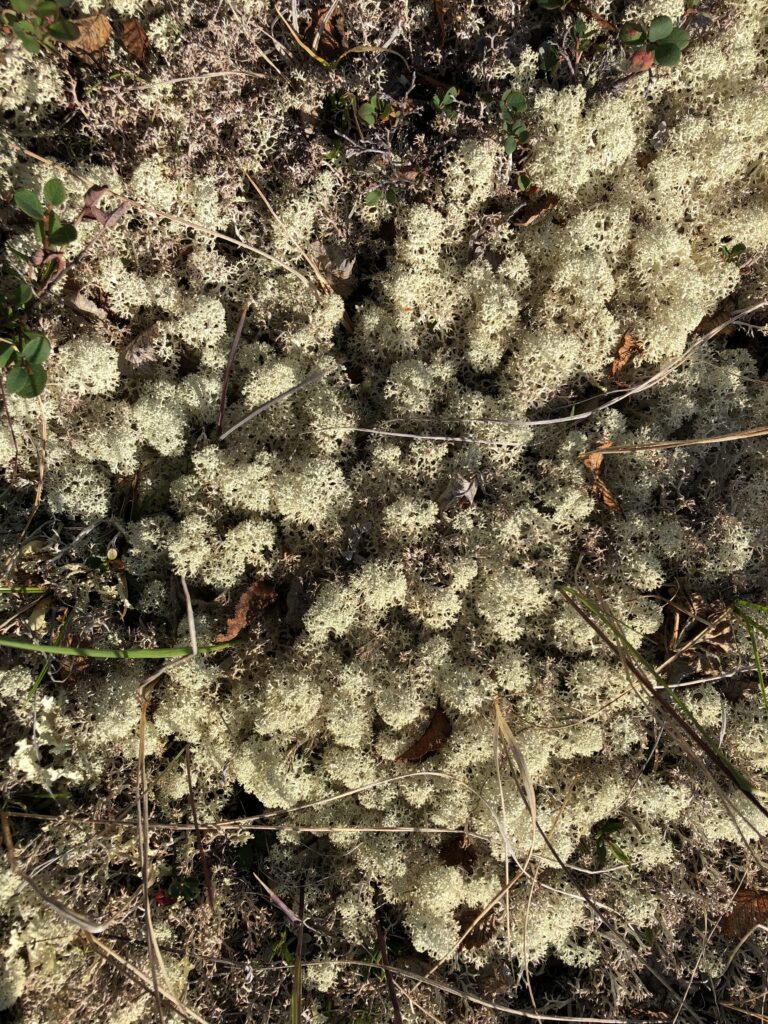
Figure 21. A close up shot of lichen in the tundra. Caribou rely on lichen in the winter as their primary food source and must locate and access patches of lichen through the snow. (credit: Hana Travers-Smith)
Hana’s project will try to map the rate of lichen fragmentation across the Yukon and understand how the movement and location of caribou are responding to these changes. Results from Hana’s research will be coming this spring!
The supervisor chips in!
The Resilience project is taking Team Shrub in places that we have not gone before. Sure, as a team we have headed out to the tundra for almost two decades now every summer. But the Resilience project is providing an opportunity for us to look at those tundra ecosystems and the data that we collect differently.
The research is pretty clear, ours, but also that of Arctic scientists working at sites around the circumpolar Arctic. Change is rapid and accelerating in tundra ecosystems – some of that change is gradual and some of the change is abrupt. Team Shrub is observing all paces of change in our research from the slow shifts in the tundra plants, through to the shrubs taking over in the valleys to huge landslides that happen in a matter of seconds – ripping the tundra off of the slopes because of rapid permafrost thaw.
The Resilience project is allowing us to work collaboratively with mathematicians, physicists and mathematical ecologists. Together we’re asking what predicts why change can be rapid or more gradual, whether that change leads to permanently different states for these tundra ecosystems or whether the tundra ecosystems can gradually return to its previous state.
Most urgently, this synergy grant is allowing our combined expertise to come together to understand whether climate change is altering the rules of how tundra ecosystems can withstand and counteract change. Whether it is through spatial patterns of plants and permafrost thaw or the change in the timing of plant growth and the assembly of different species across these vast, frozen landscapes, the resilience of the tundra biome to climate change has never been more important to study.
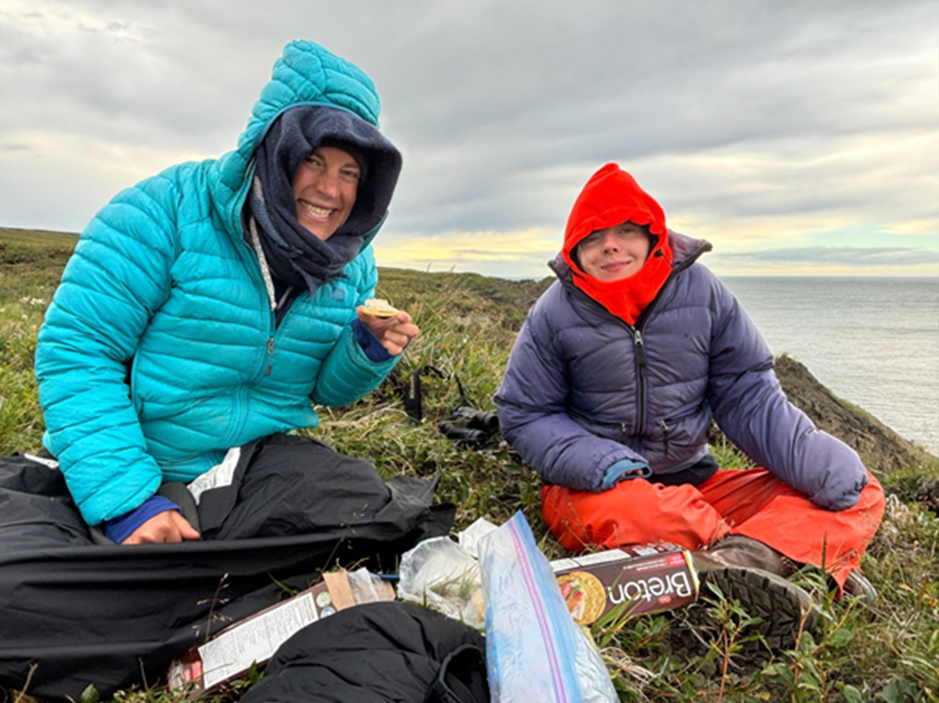
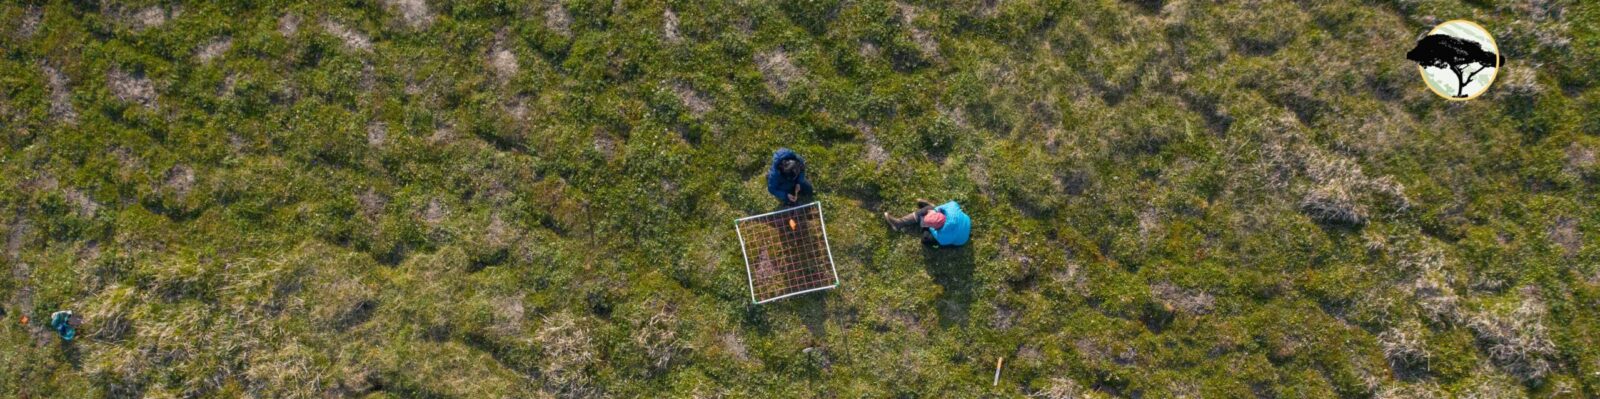
Figure 22. Isla and Ciara have a snack on a chilly day on the tundra. (credit: Cameron Eckert)
The fieldwork cycle will resume
As we write this blog post, some of us sitting at a café in a grey rainy Vancouver, others from the comforts of their home or our offices at UBC (all equally rainy), we dream of being back in the vastness of the North under the midnight sun and look forward to the exciting field work that next summer will bring.
Next summer is already shaping up to be an exciting (and ambitious) one in the field! We will be continuing our fieldwork, collecting even more data and will also have some new faces on the island working on their new projects! The pressure exerted by climate change on Arctic ecosystems has never been greater. The collection of field data must continue to capture both dramatic changes such as landslides and long-term effects like vegetation change. A complementary understanding of changes of differing paces will be necessary to assess how resilient the Arctic is to climate change.