Unified spatial savanna model
We will begin with the simplest building blocks to fully analyse and understand the fundamental behaviour of this ecosystem before increasing the complexity of the model. We will use a combination of simulations, mathematical bifurcation analyses and numerical continuation in one and two spatial dimensions (Sherratt 2012, Van der Stelt et al 2013, Tzuk et al 2020) to answer the following questions: Under which conditions do sharp or gradual spatial boundaries exist between forests, open savanna, savanna woodlands, and grasslands or bare soil? How are those boundaries moving with respect to climate, herbivory and fire? Under which conditions do spatial patterns occur (Turing or non-Turing)? Does the (homogeneous) model predict tipping and can this be evaded by spatial effects? How does spatial patterning interact with fire and savanna/forest resilience? RESILIENCE will be able to link models with observations from real ecosystems, evidenced by the comparisons between model predictions and observations in dry savannas (Getzin et al 2016, Bastiaansen et al 2018).
We will then link our model to real-world observations; to ensure feasibility and sufficient data we will focus on two primary drivers of ecosystem change: fire and water availability. Therefore, we will explore spatial signatures of vegetation boundaries at wet ranges between tropical forests and savannas in South America, Africa and Australia, using moving window algorithms to calculate spatial metrics such as spatial covariance between those types. We will do so using remote sensing data at multiple spatial and temporal resolutions. At dry and mesic ranges we will analyse savanna-grassland/bare soil boundaries and open savanna-savanna woodland boundaries using similar procedures. These findings will then be related to freely available existing data on our drivers water availability and fire through correlating known soil moisture and fire risk indicators with the metrics of spatial boundaries.
Forest-savanna patterning affects savanna and forest resilience through fire (Staver et al 2011). Depending on the shape, size and distribution of forest and savanna patches associated with fuel load, fire may or may not percolate through the savanna and forest for certain levels of coexistence (Van Nes et al 2018). First, we will use our spatially explicit savanna model to generate hypotheses of how different spatial patterns of fuel connectivity encourage or evade tipping points via fire. Next, we will test these hypotheses empirically using satellite images of forest-savanna boundaries in Africa and South America. This combined research will allow us to understand savanna and forest resilience and predict the movement of forest-savanna boundaries based on snapshots of coexistence states (Fig. 3).
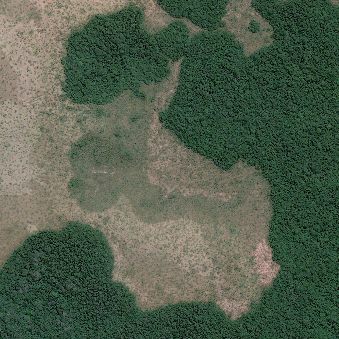
Figure 3. Forest-savanna coexistence states in Gabon (Google Earth) (Rietkerk et al 2021).
We will then extend the unified spatial savanna model to include biomass variables for functional groups of species that share similar values of the identified functional traits. The extended community model will capture environmental filters, such as tolerance to water stress and fires, and interspecific competition for growth-limiting factors, such as water, nutrients and light. The emerging community assemblages, as model solutions, will be characterized by three community level properties: (i) composition (location in trait space of most abundant functional groups), (ii) functional diversity (distribution of traits around the most abundant ones) and (iii) total biomass (Meron 2016).
Long-term spatial-temporal monitoring data of African woodlands, covering sub-Saharan Africa in the southern hemisphere, from the forest-savanna boundary in the north towards the savanna-dryland transition in the south, will be available from the SEOSAW network (SEOSAW 2021, Godley et al 2021). SEOSAW is a collaborative, well-established network actively collecting vegetation data focussing on strengthening African collaborations. The SEOSAW data includes plot-level vegetation composition, species diversity and stem density data and can be used to estimate spatial patterning across near-continental scale.
We will collect additional vegetation transect data along stress gradients (e.g., aridity, temperature) in our focus biome savanna and tundra (section 4.2) in areas where we will link this data to long-term dynamics and spatial patterns. The transect data together with the drone data will be used to determine the spatial association of contrasting plant traits in terms of acquisition of key resources (e.g., morphological plant traits related to water use strategy). We will analyse how the strength of the spatial association of different plant traits varies along the stress gradient and relates to the spatial patterns.
Researchers involved